- May 29, 2015
- Posted by: Wevio
- Category: Market Research & Analysis, Wevio Blog


Global Coffee Industry Instructing Facts
- Coffee export alone is a $20 billion dollar industry, mostly consumed by industrialized nations
- After crude oil, coffee is the most sought after commodity in the world; Coffee is worth over $100 billion worldwide. That puts it ahead of commodities like natural gas, gold, oil, sugar and corn.
- Worldwide, we drink over 500 billion cups of coffee every year of that 14 billion are Italian espressos.
- Coffee farms are the economic livelihood of over 25 million people. Coffee is grown in over 50 countries in Asia, Africa, South America, Central America and the Caribbean. And 67 percent of the world’s coffee is grown in the Americas alone.
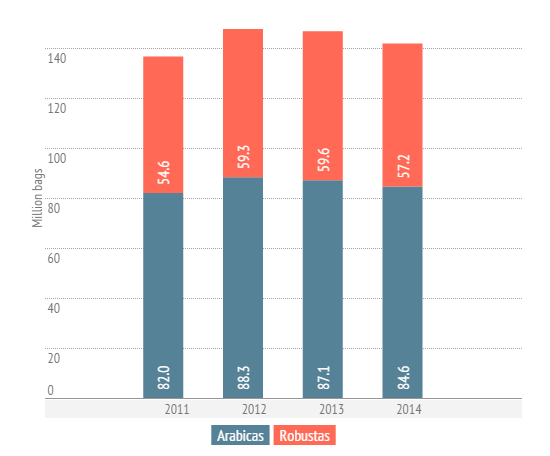
- Arabica and robusta are the two main commercially grown and sold coffee beans. Arabica is the more common type of bean grown (70 percent of coffee is Arabica), and it’s considered more flavorful. Robusta is hardier and cheaper, most commonly seen in instant coffee jars.
- Over half of Americans over the age of 18 drink coffee daily. American coffee drinkers average three and a half cups of coffee every day.
- Coffee is the source of 75 percent of America’s caffeine, a substantial amount more than any tea, soda or energy drink.
- Coffee shops are the fastest growing niche in the restaurant business. Coffee shops have a seven percent annual growth rate. Starbucks, by far America’s coffee giant, is the third largest restaurant chain in the U.S
- 90 percent of the world’s coffee production takes place in developing countries. The top three producers of coffee are Brazil, Vietnam and Columbia.
- Finland drinks the most coffee per capita in the world, Brazil at number 13, USA ranks 5th per capita
- According to the World Wildlife Fund, of the 50 countries with the highest deforestation rates from 1990 to 1995, 37 were coffee producers
The latest facts and figures about the global coffee trade from the International Coffee Organization.

Coffee Trade Statistics in 2014
9.98 million bags
were exported in March 2015, compared with 10.25 million bags in March 2014
3.3% decrease
In coffee exports during the first six months of the year 2014/15 (Oct/14 to Mar/15) compared with the first six months of the last year
67.36 million bags
of Arabica were exported in the twelve months ending with March 2015, compared to 69.03 million bags last year
44.79 million bags
of Robusta were exported in the twelve months ending with March 2015, compared to 44.22 million bags last year
Global Coffee Production
141.9 million
Estimated number of 60 kg bags of coffee produced in 2014/15
3.3%
Estimated reduction in global coffee production in 2014/15 compared to 2013/14

2.8%
Estimated reduction in global production of Arabica coffees in 2014/15
4.1%
Estimated reduction in global production of Robusta coffees in 2014/15
Global Coffee Consumption
149.3 million
Estimated number of 60 kg bags of coffee consumed in calendar year 2014
2.3%
Average annual growth rate in global coffee consumption since 2011
Demand is Strong
in many countries, particularly in traditional markets (Canada, EU, Japan, Norway, Switzerland, USA, others) but the biggest potential is in emerging markets (Algeria, Australia, Russia, South Korea, Turkey, Ukraine, others) and coffee exporting countries
