- May 9, 2015
- Posted by: Wevio
- Category: Market Research & Analysis, Wevio Blog


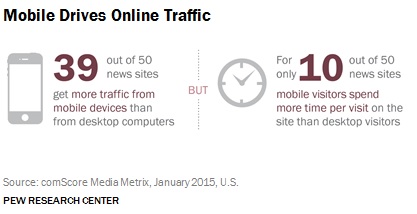
According to a new comScore report analyzed by the Pew Research Center, “State of the News Media 2015” news websites now receive more unique monthly visitors from mobile devices than desktop computers. According to resent statistics of 2015, 39 of the top 50 digital news websites have more traffic to their sites and associated applications coming from mobile devices.
Americans’ news habits are changing drastically with the rise of a mobile first mindset and trend. However, although mobile and social news are rising, legacy platforms have not changed significantly in terms of viewer consumption. Local TV continues to capture broadcast viewers, with slight increases for evening (3%) and morning (2%) newscasts and larger ones for early morning and midday in 2014. Network television news saw a second straight year of audience growth (5% in evening and 2% in morning), for a combined average evening viewership of roughly 24 million.
Total number of unique visitors and average minutes per visit for January 2015 (in thousands)
| Unique Visitors | Average Minutes per Visit | ||||||
| Rank (According to Pew Research Center Analysis) | Media | Total Unduplicated Digital Population | Desktop | Mobile | Total Unduplicated Digital Population | Desktop | Mobile |
| 1 | Yahoo-ABC News Network | 127995 | 59099 | 93160 | 4.3 | 3.9 | 2.3 |
| 2 | CNN Network | 101540 | 53544 | 64632 | 4.2 | 2.9 | 3.3 |
| 3 | NBC News Digital | 101145 | 42207 | 69810 | 4.8 | 5.1 | 2.6 |
| 4 | HUFFINGTONPOST.COM | 100000 | 44184 | 67095 | 2.4 | 2.5 | 1.9 |
| 5 | CBS News | 84153 | 36431 | 58303 | 4.5 | 3.5 | 3.1 |
| 6 | USATODAY Sites | 78804 | 37718 | 50195 | 3.4 | 3.2 | 2.5 |
| 7 | BUZZFEED.COM | 77992 | 22749 | 57724 | 2.8 | 3.1 | 2.1 |
| 8 | The New York Times Brand | 57132 | 29013 | 34802 | 4.5 | 5.9 | 2 |
| 9 | Fox News Digital Network | 56857 | 28091 | 35406 | 5.1 | 5.6 | 2 |
| 10 | Mail Online / Daily Mail | 51181 | 21153 | 33844 | 2.5 | 2.7 | 2.3 |
| 11 | WASHINGTONPOST.COM | 47815 | 21328 | 30393 | 3.3 | 3.6 | 3 |
| 12 | BLEACHERREPORT.COM | 44429 | 14645 | 32938 | 2.8 | 2.2 | 3.5 |
| 13 | BUSINESSINSIDER.COM | 37309 | 15278 | 24101 | 2 | 2.3 | 1.7 |
| 14 | ELITEDAILY.COM | 33415 | 6534 | 27689 | 1.4 | 1.5 | 1.4 |
| 15 | BBC | 32774 | 21231 | 14479 | 2.9 | 2.7 | 2 |
| 16 | CNET.COM | 30482 | 21177 | 11307 | 2.4 | 2.2 | 1.9 |
| 17 | The Guardian | 28153 | 13121 | 16483 | 2 | 2 | 1.8 |
| 18 | MSN News | 26883 | 22138 | 6033 | 2.5 | 2.4 | 2.4 |
| 19 | NPR | 26573 | 11258 | 16502 | 1.8 | 2 | 1.6 |
| 20 | NYDAILYNEWS.COM | 25900 | 11294 | 15692 | 2.6 | 3 | 2.3 |
| 21 | LA Times | 24763 | 13051 | 12932 | 1.5 | 1.2 | 2.1 |
| 22 | NYPOST.COM | 22940 | 9831 | 14192 | 2.1 | 2.1 | 2 |
| 23 | TIME.COM | 22688 | 10025 | 13289 | 2.4 | 2.2 | 1.6 |
| 24 | MASHABLE.COM | 20951 | 9669 | 12029 | 1.5 | 1.3 | 1.7 |
| 25 | SFGATE.COM | 19043 | 9948 | 10080 | 2.2 | 2.1 | 2.2 |
| 26 | SLATE.COM | 18346 | 7525 | 11533 | 2.4 | 2.8 | 2 |
| 27 | UPWORTHY.COM | 17513 | 4684 | 13202 | 1.7 | 2 | 1.6 |
| 28 | THEBLAZE.COM | 16924 | 5579 | 11855 | 2.9 | 2.9 | 2.8 |
| 29 | Telegraph Media Group | 16751 | 8378 | 9058 | 1.8 | 1.8 | 1.8 |
| 30 | USNEWS.COM | 16226 | 9442 | 7556 | 2.3 | 2.3 | 2.2 |
| 31 | VICE.COM | 15558 | 4193 | 9375 | 3 | 1.7 | 2.2 |
| 32 | CHRON.COM | 14424 | 8752 | 6421 | 1.7 | 1.7 | 1.9 |
| 33 | GAWKER.COM | 14079 | 5724 | 8954 | 1.9 | 1.7 | 2.3 |
| 34 | EXAMINER.COM | 14053 | 7307 | 7275 | 1.7 | 1.9 | 1.5 |
| 35 | VOX.COM | 13598 | 6070 | 7862 | 1.5 | 1.5 | 1.6 |
| 36 | Chicago Tribune | 13125 | 5940 | 7699 | 2.2 | 2.1 | 2.3 |
| 37 | THEDAILYBEAST.COM | 12918 | 5140 | 8215 | 2.4 | 2.4 | 2.2 |
| 38 | SALON.COM | 12727 | 5333 | 7757 | 1.8 | 1.6 | 2 |
| 39 | MIC.COM | 12283 | 3511 | 8928 | 1.5 | 1.5 | 1.4 |
| 40 | Mirror Online | 12137 | 4404 | 8025 | 1.7 | 1.6 | 1.7 |
| 41 | INDEPENDENT.CO.UK | 11516 | 4980 | 6810 | 1.5 | 1.6 | 1.5 |
| 42 | FREEP.COM | 10632 | 3911 | 6972 | 2.4 | 2.4 | 1.9 |
| 43 | Bostonglobe.com Sites | 9896 | 4550 | 5614 | 2.5 | 3.1 | 2.1 |
| 44 | THEATLANTIC.COM | 9166 | 4422 | 4977 | 2.3 | 2.3 | 2.3 |
| 45 | MLIVE.COM | 8779 | 2979 | 6009 | 2.4 | 2.6 | 2.2 |
| 46 | ENGADGET.COM | 8632 | 5302 | 3593 | 1.9 | 1.8 | 2 |
| 47 | TECHCRUNCH.COM | 7931 | 4746 | 3417 | 1.6 | 1.6 | 1.6 |
| 48 | BOSTON.COM | 7765 | 3511 | 4417 | 1.7 | 1.6 | 1.8 |
| 49 | AL.COM | 7691 | 2634 | 5278 | 3.1 | 4 | 2.5 |
| 50 | Dallas Morning News | 7308 | 3106 | 4318 | 2.6 | 3.4 | 1.9 |
Source: ComScore database Note: Total Digital Population is the unduplicated combination of the desktop (web browsing and video) and mobile (websites and apps) traffic figures. For that reason, desktop and mobile figures combined may exceed the total digital population number.